Sunday, July 6, 2008
Triangular Plot
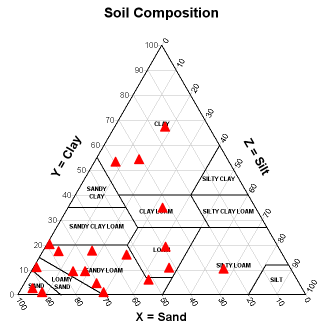
A triangle plot, or ternary plot, is a graph that finds the median of three variables through percentages. These graphs are most commonly used in studies involving the composition or texture of soil or rocks. The below graph has divided regions of the map to better identify different types of soil.


Subscribe to:
Post Comments (Atom)

No comments:
Post a Comment